MD’s Message
Dear Valued Stakeholders, Partners, and the Southland Rubber Family,
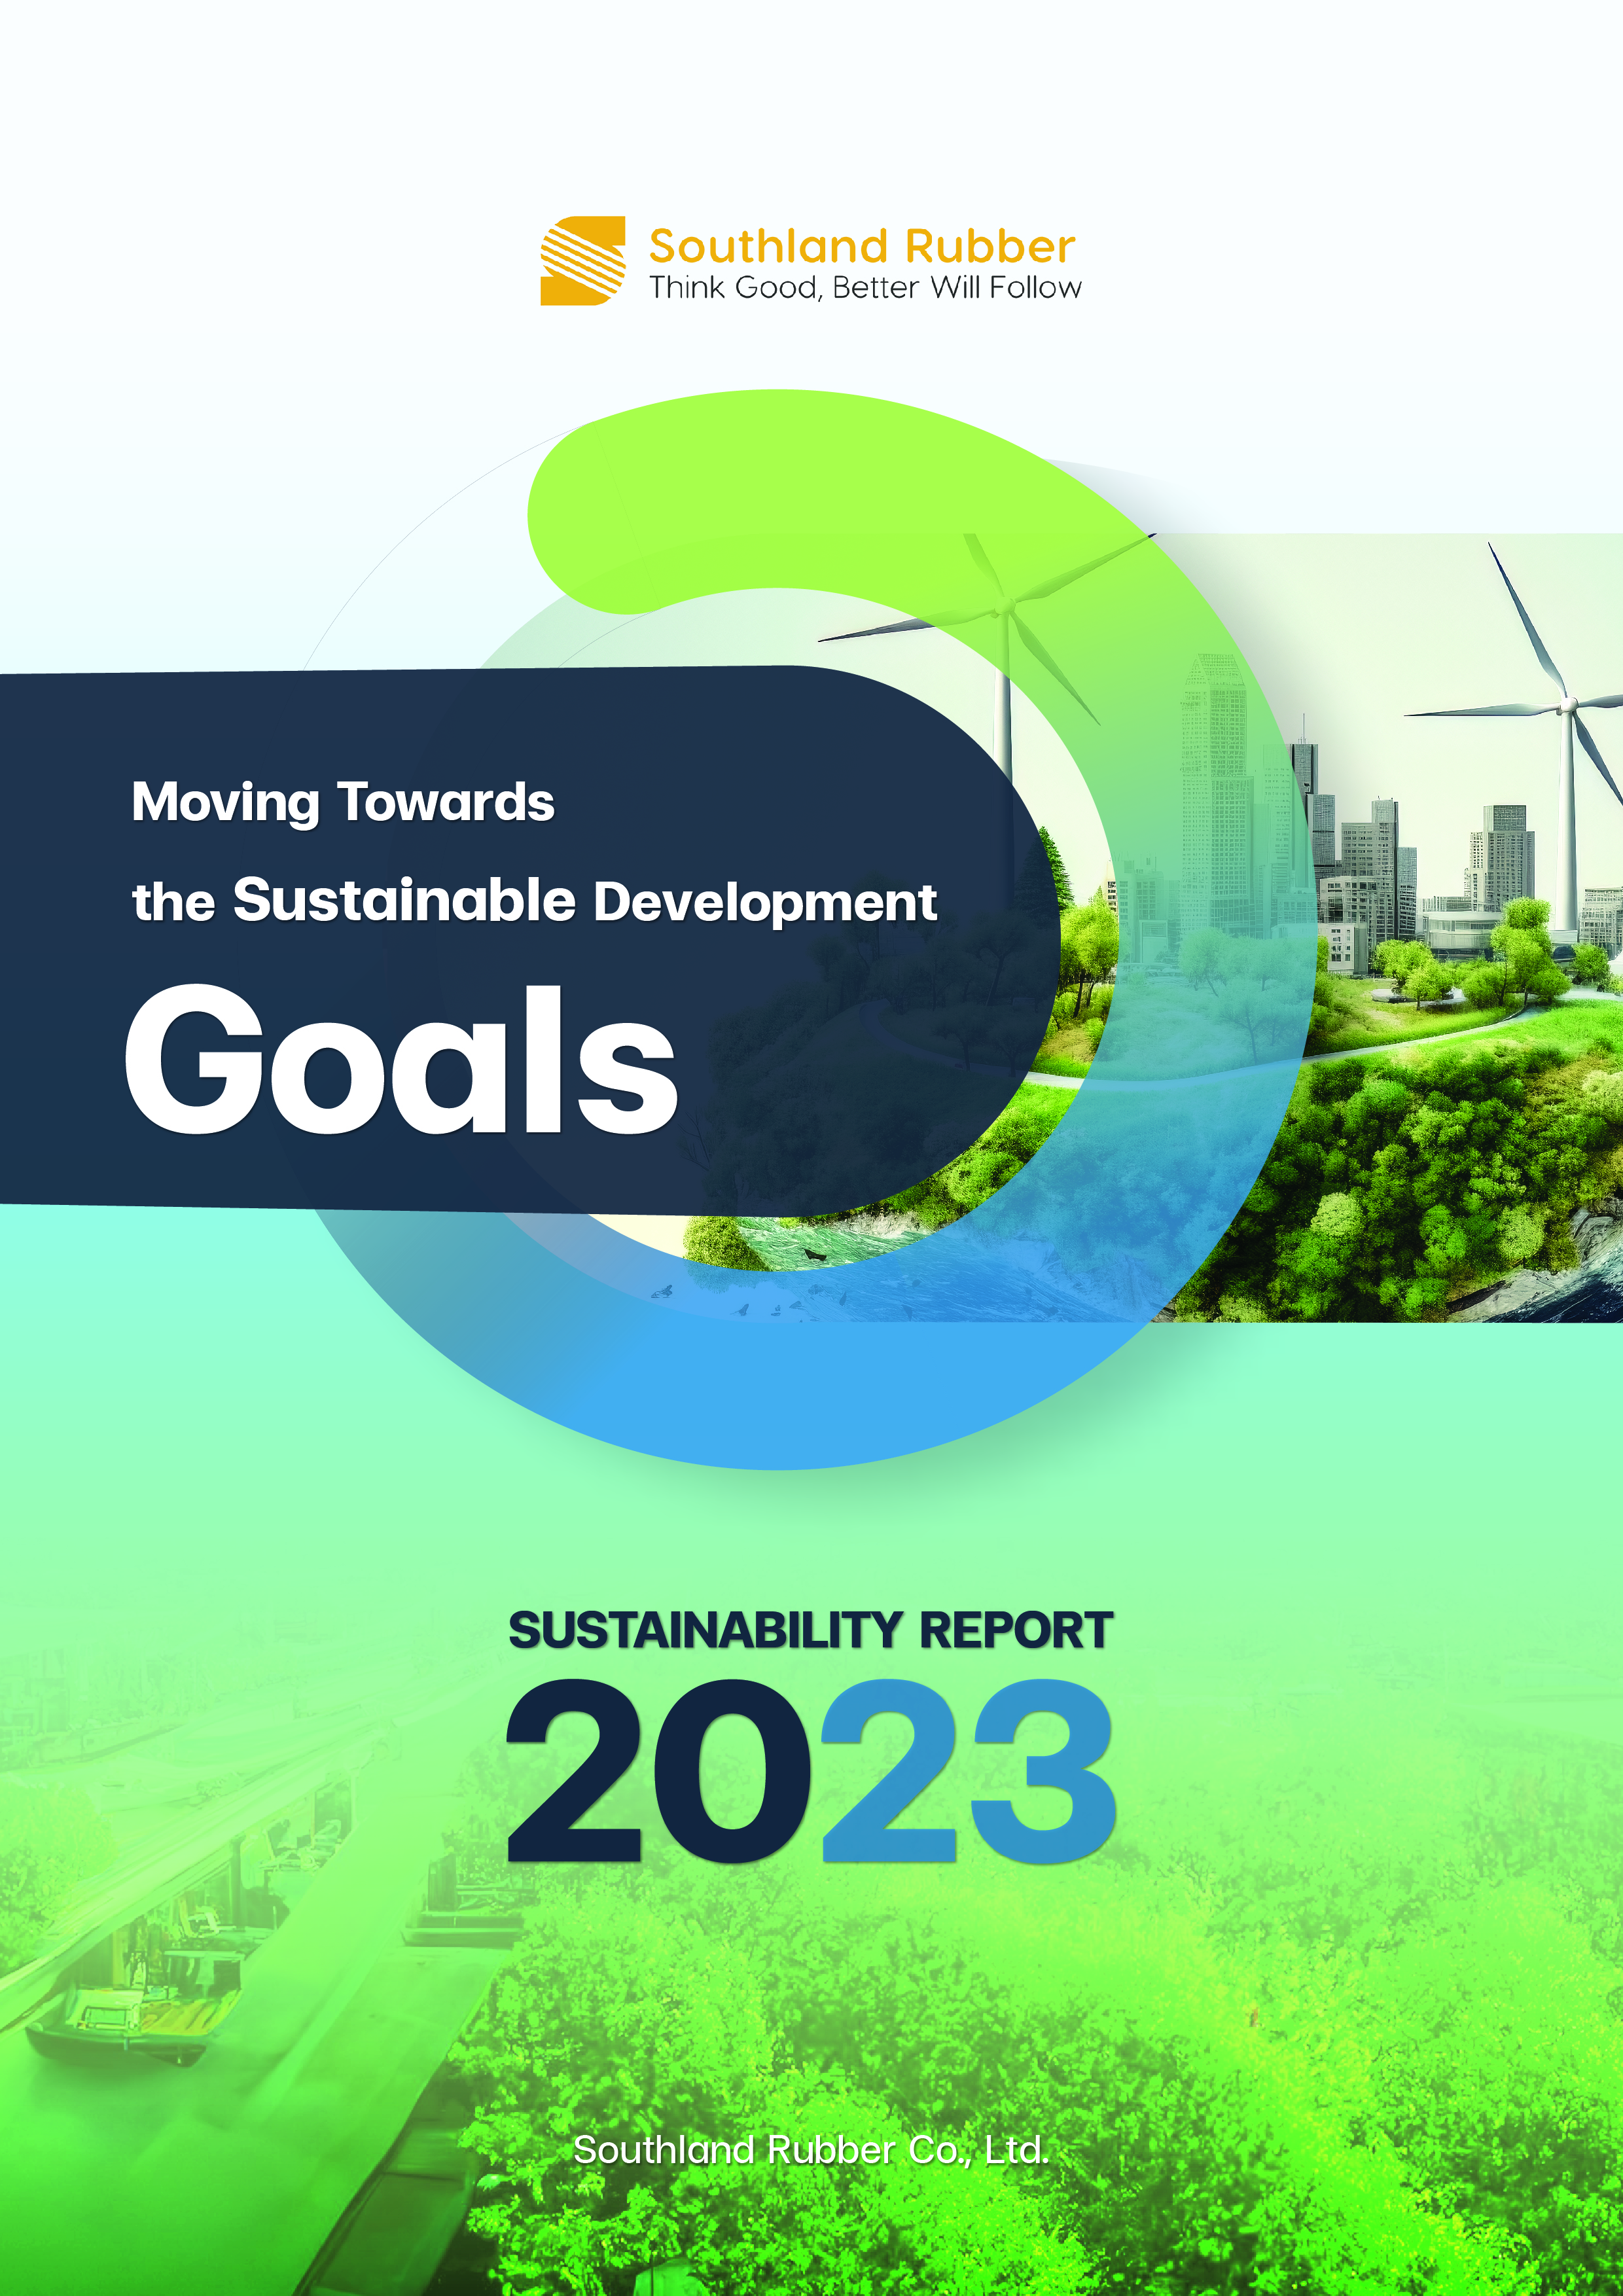
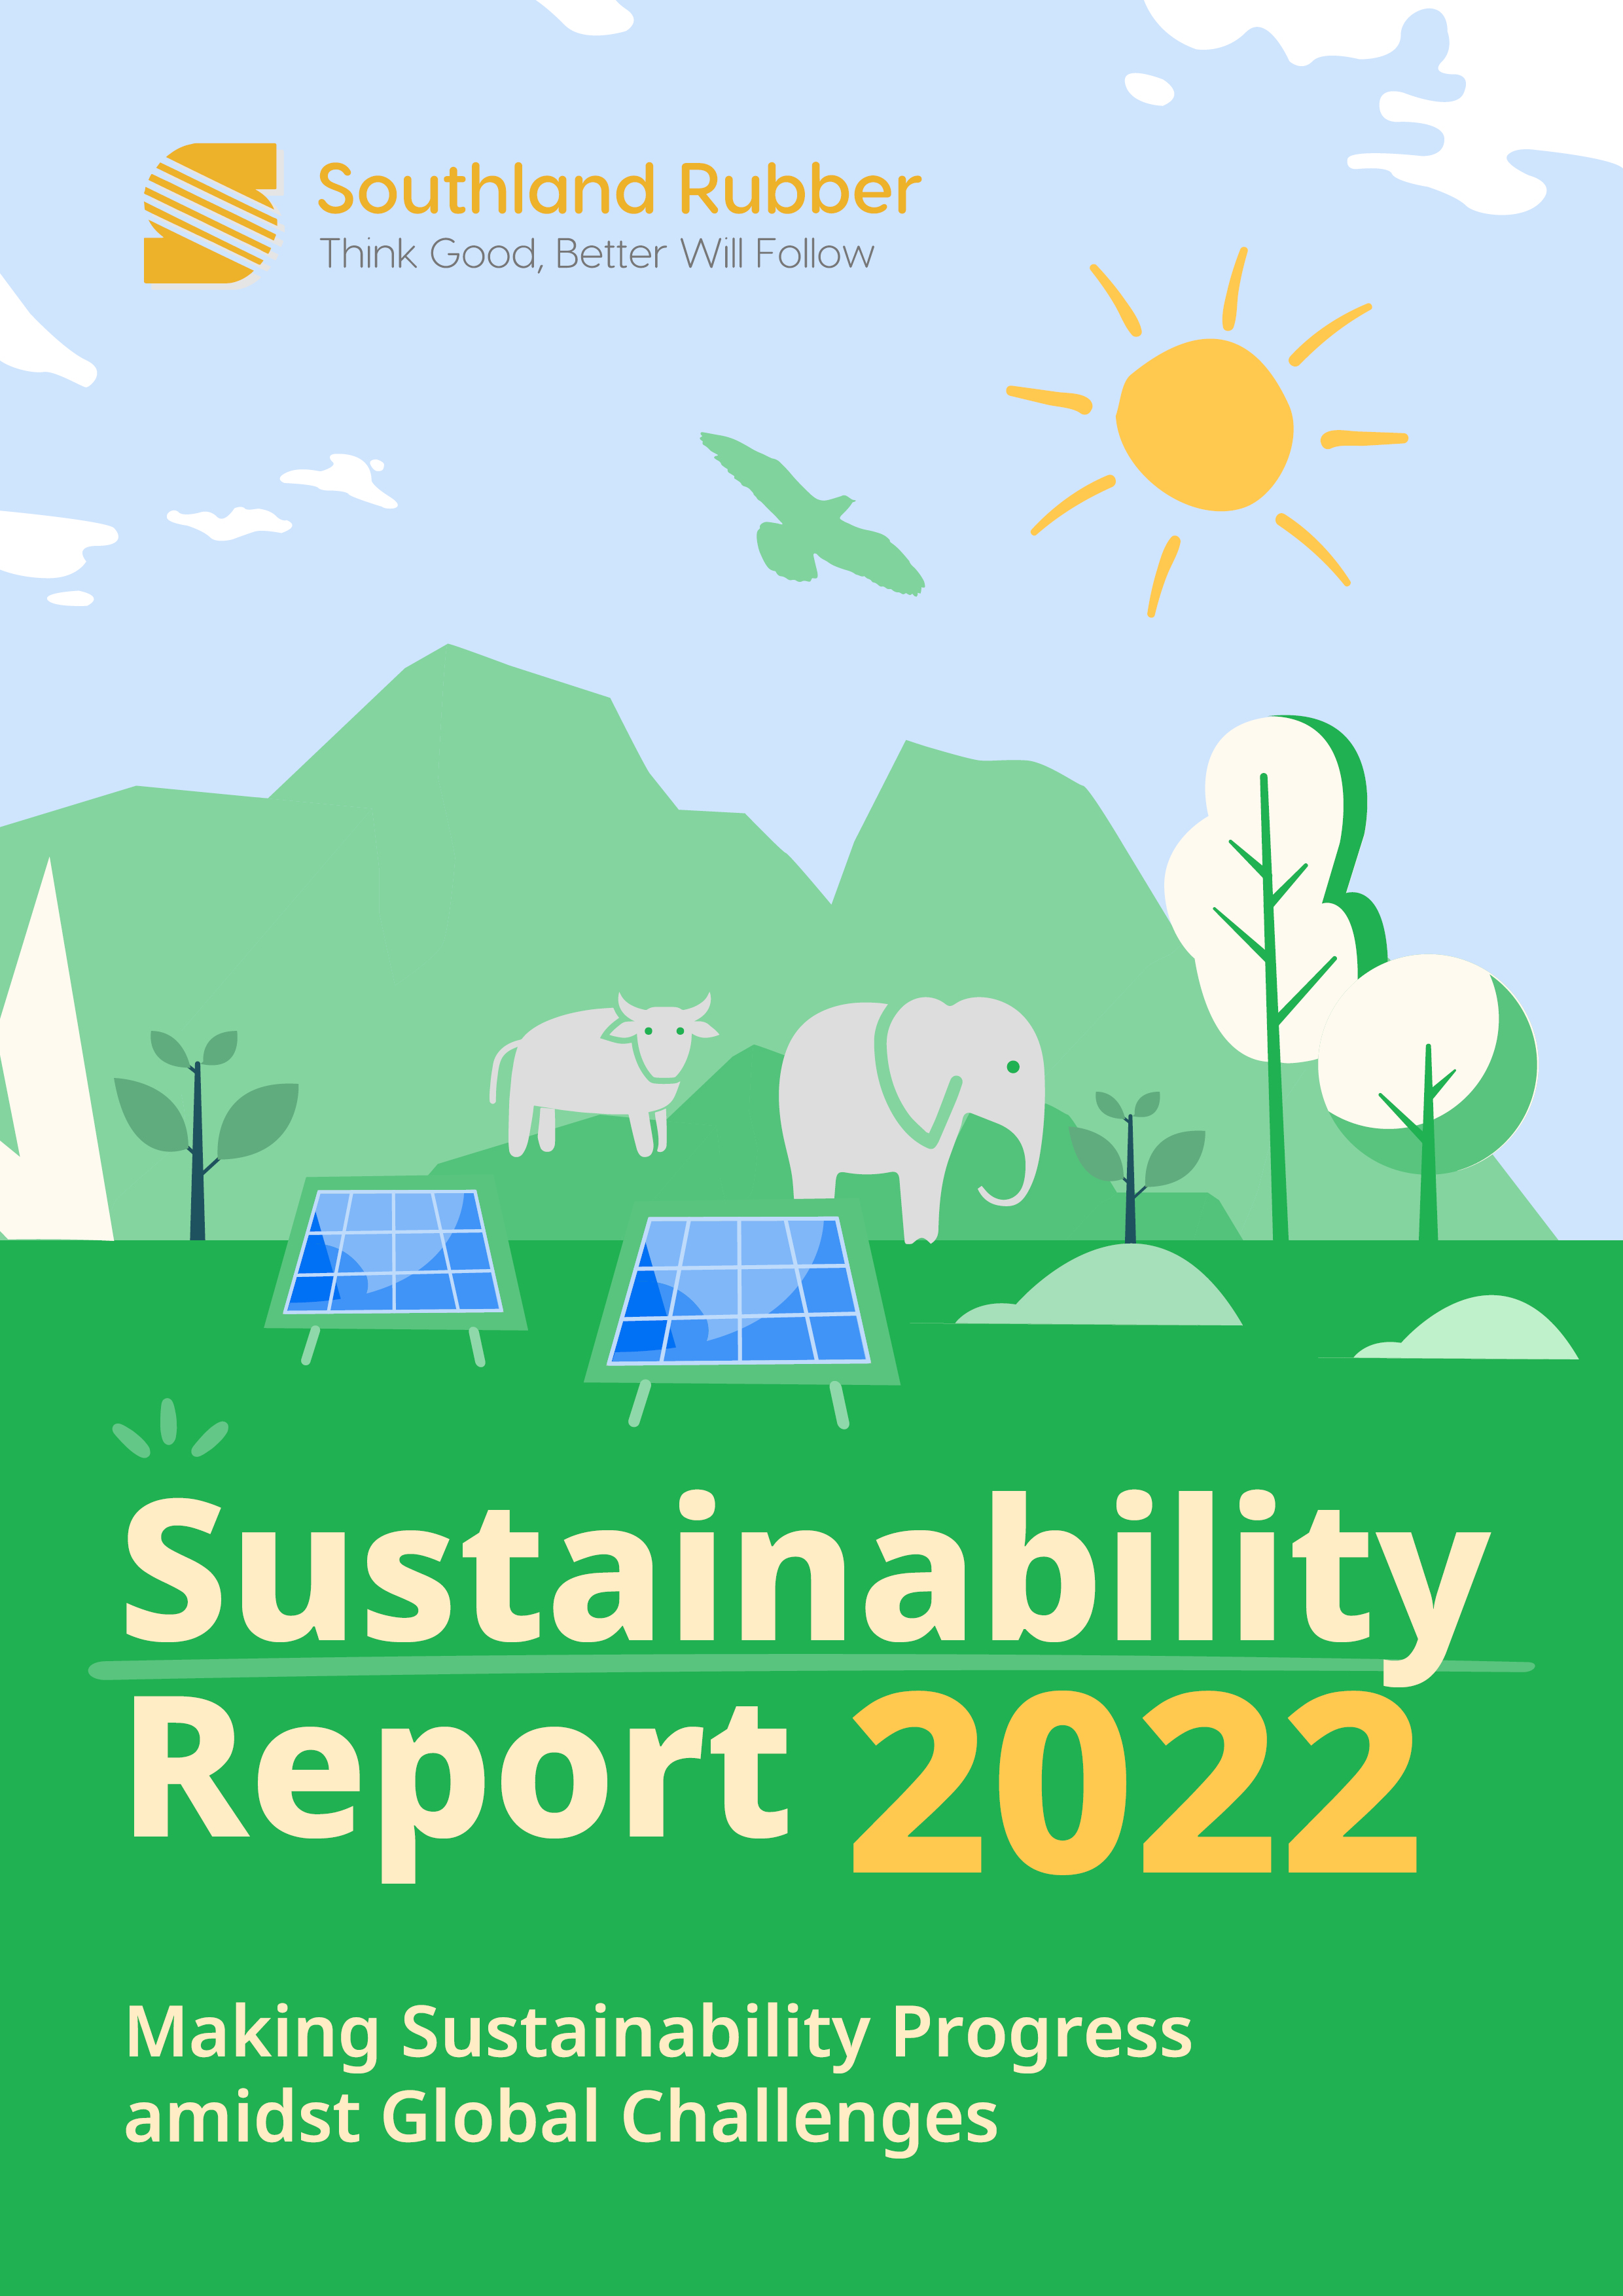
As we reflect on another transformative year, I am honored to present the 2024 Sustainability Report of Southland Rubber Company. This marks not only our eighth consecutive year of public sustainability disclosure but also a pivotal moment in our journey— where aspirations are translated into measurable progress, and where values are reinforced through action.
Since the launch of our first sustainability report in 2017, we have steadily embedded the principles of sustainability across every level of our operations. Today, we are proud to stand as the largest privately-owned natural rubber processor in Thailand, with 17 certified processing facilities, 4,000+ employees, and deeply rooted presence in the communities we serve. We recognize that our growth must not come at the expense of the planet or people, and we remain steadfast in our belief that “Think Good, Better Will Follow”—a principle that continues to inspire our collective path forward.
Our Business: Resilient Growth, Inclusive Practices
2024 was a defining year of both growth and responsibility. As Thailand’s largest privately-owned natural rubber processor, and a far-reaching supply chain, we recognize that scale comes with stewardship.
Our supply chain verification now spans over 100,000 hectares of rubber-growing land. Through direct engagement with smallholders, legality verification, and GPS-based mapping, we ensured compliance with the EU Deforestation Regulation (EUDR)—without marginalizing the small farmers who form our backbone. Our upgraded traceability platform and supplier due diligence system reflect original-source data and support a transparent, inclusive value chain.
We also expanded community programs, including education loans, healthcare subsidies, and facility upgrades at RSS sites, where older female workers had voiced specific needs. Our “People First” approach is matched with targeted investments in workforce safety, inclusion, and workplace satisfaction.
Governance: Principles in Practice
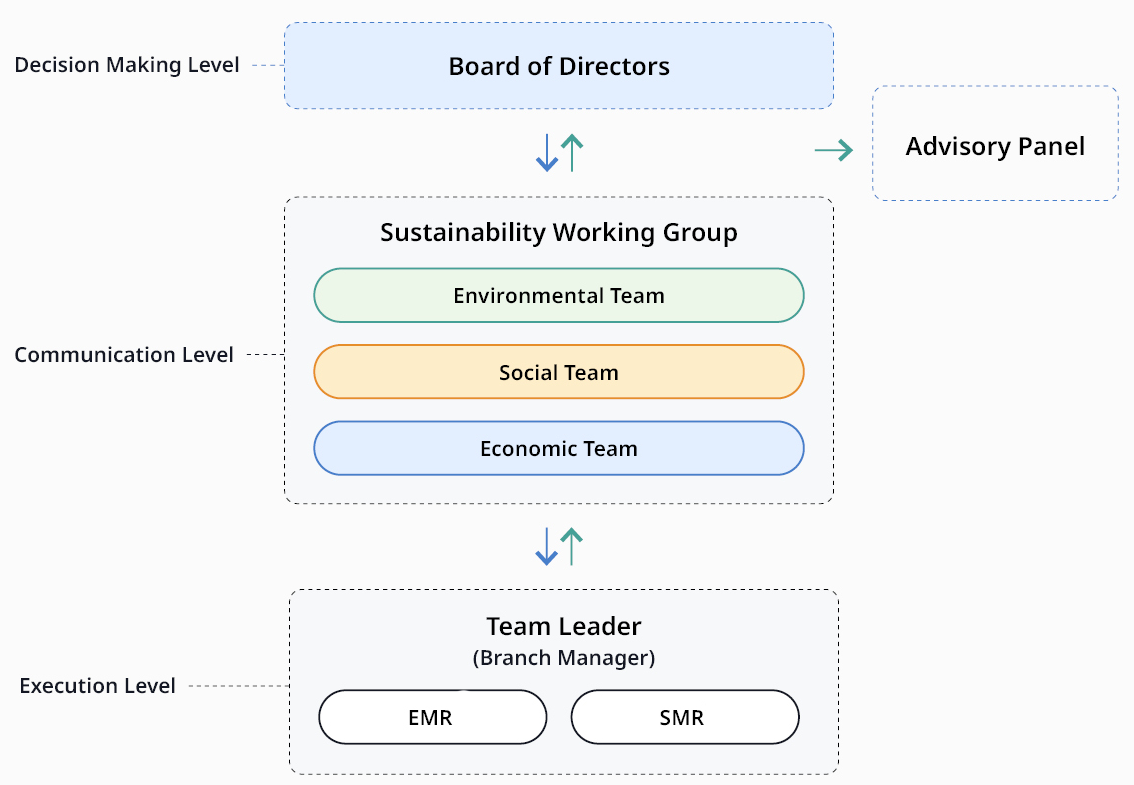
The Board of Directors makes various decisions regarding operations for sustainability, and based on those decisions, an organization has been established to plan and promote specific measures in the three aspects of the environment, society, and the economy. Under this organization, execution teams are placed at each factory and are responsible for implementing measures at the factory level.
At Southland Rubber, governance is more than compliance—it’s a culture. In 2024, we reinforced our values through the continued rollout of our Compliance program, ensuring 100% employee training in areas including sustainability, human rights, anti-bribery, and data protection. All whistleblower reports were resolved confidentially and fairly, and no incidents of corruption were reported.
We also have a goal of “Zero accidents” at all our facilities, which we strive to achieve through safety audits and corrective actions, daily toolbox meetings, KYT (Employee Safety Awareness) awareness programs, and digital incident reporting. Our leadership framework is built on our core values: Integrity, Vision, Respect, and Passion—and every policy, engagement, and system are designed to reflect them.
Issues to be Taken: Sustainability as Strategy
As a measure to mitigate climate change, we are actively promoting the switch to renewable energy. As part of this, we are expanding the rooftop solar power generation equipment at the STR factories and building a solar power plant in Phetchabun.
In order to promote de-carbonization in our business, we are also focusing on improving energy efficiency by promoting the electrification of transportation used in the factory and upgrading IT systems. We are taking steps to align our carbon reduction actions to align with Science Based Target initiative (SBTi) process with the view to eventually making commitment to SBTi standards.
With the aim of restoring a wide range of ecosystems, we are promoting tree planting, agroforestry, biodiversity surveys, and wildlife protection activities through the “Nature in the Factory” program launched in 2018.
In our roadmap toward the future, we will expand biodiversity risk mapping and promote supplier classification in accordance with the EUDR.
These reflect our commitment to the SDGs and our belief that environmental measures need to be integrated into everyday business decisions.
Looking Forward
As we progress toward 2025, we reaffirm our mission to be a reliable and dependable supplier of quality natural rubber,
grounded in transparency, innovation, and sustainability. Our key priorities will include:
- Operationalizing our solar farm and expanding renewable energy access
- Completing supplier risk mitigation for EUDR
- Scaling biodiversity risk mapping across upstream zones
- Replacing diesel equipment with EVs to cut emissions
- Advancing toward SBTi validation and related carbon emissions standards
Together, Let us continue to Think Good. Let us do better. And tomorrow let us lead sustainably.
Ng Tze Kiat
Managing Director
* The content of this message was originally posted on Southland Rubber's Sustainability Report 2024.
* The English version of the message shall prevail over the Thai translation.